Why Most Active Managers Fail
Investors are pulling their money from many high-fee actively managed hedge funds, whose managers seem chronically unable to outperform the market and generate alpha.
These managers are failing not for lack of intelligence, but rather because they are relying on a forecasting methodology that doesn’t work. Most active managers analyze securities on a case-by-case basis, coming up with forecasts based on their expert appraisal of future cash flows.
But there are few hypotheses more thoroughly proven in the social sciences than Paul Meehl’s claim that expert clinical judgment is inferior as a predictive method to simple statistical and actuarial models. In fact, Daniel Kahneman won the Nobel Prize in part for elaborating on this simple insight. Yet 15 years after he won the Nobel, very few investors are actually implementing his methods. (If you have not looked at the track record of expert forecasts, we highly recommend Philip Tetlock's study Expert Political Judgment, which famously showed that "specialists are not significantly more reliable than non-specialists in guessing what is going to happen in the region they study").
Verdad is different. Unlike the vast majority of actively managed funds, we rely on proven forecasting methodologies. Specifically, we use a forecasting methodology advocated by Kahneman and Meehl called “reference class forecasting” or “base rate forecasting.” The method is simple:
1. Identify a reference class
2. Obtain the statistics of the reference class
3. Use specific information about the individual case to adjust the baseline prediction
By establishing a base rate or outside view of the problem prior to analyzing the individual case, forecasters can significantly increase accuracy. We have applied this methodology in a rigorous and systematic way to equity investing. Below we explain exactly how.
1. Identify a reference class
The first step is to categorize stocks in order to develop an appropriate reference class of comparable assets from which to derive the base rate.
The reference class defines the strategy, and we believe the most successful investors are successful primarily because of choosing the right reference class, rather than because of their skill at operating within the reference class (Mitt Romney was successful because he bought leveraged small value stocks with potential for operational improvement, Warren Buffet because he bought value stocks with insurance float, Ray Dalio because he used leverage to enhance bond returns).
Our reference class is derived from private equity — historically the best performing asset class by a huge margin — from the broader public equity markets. We found that private equity investments are much smaller than most public equities, significantly more leveraged, and, until the mid-2000s, significantly cheaper.
We took the universe of small, leveraged, value stocks in the public markets and we analyzed its historical performance from 1964 to 2013. We also tested a variety of other factors, developed by academic finance, to see which of these factors were statistically significant in predicting returns among these leveraged small value equities.
We then defined a rigorous set of parameters that defined our target universe. Our target stocks would be cheap (generally trading at <7x EBITDA), small (generally less than $1B in market capitalization), and highly leveraged (generally >50% net debt/enterprise value). And in that universe, we would choose stocks with improving asset turnover, low short interest, a track record of debt pay-down.
2. Obtain the statistics of the reference class
Our reference class — the universe of highly leveraged deep value small-micro cap stocks with strong underlying financials and limited short interest — performs very differently from the broader equity markets (as should be obvious from the volatility of our returns). We understand the statistical distribution of stocks in our reference class (and the broader reference class that includes all leveraged equities and leveraged buyouts) more thoroughly than many other market participant or scholar.
In figure 1, we show the distribution of 1-year returns of individual leveraged small value stocks from 1999 to the present compared with the distribution of the performance of the individual stocks that make up the S&P500 over the same period. Annual return is on the y-axis, while the x-axis marks individual instances (in this case, specific stocks returns over a given year period).
Figure 1: Distribution of Annual Returns of Individual Stocks: Leveraged small value vs. the S&P500
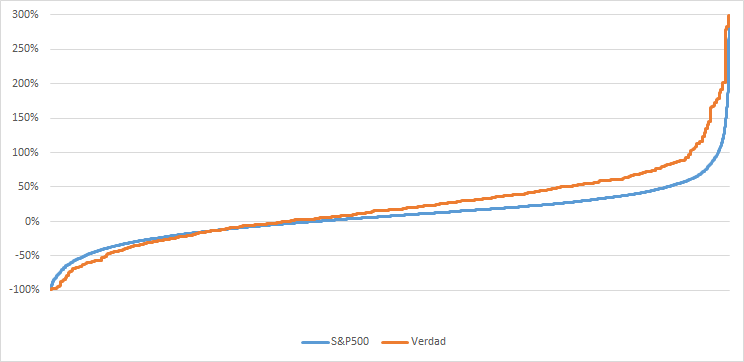
Source: Portfolio123
As you can see, the slope of the distribution is higher for Verdad’s reference class than for the S&P500. Our stocks are more likely to experience big losses and more likely to experience big gains. 18% of our stocks decline more than 25% in a given year versus 15% for the S&P500. But 43% of stocks in our universe experience a >25% gain relative to only 26% of stocks in the S&P500. This makes intuitive sense, given that our stocks are small, dirt cheap, and highly leveraged — you’d expect to see a steeper curve. The result is an average expected return of 8% for the individual stocks in the S&P500 and 20% for the individual stocks in Verdad’s reference class.
We then look at what this means on the portfolio level. In the below graph, we show the distribution of annual returns of the S&P500 and the Nikkei 225 versus the annual returns of Verdad’s strategy in the US and Japan. Annual return is on the y-axis, while the x-axis marks individual instances (in this case, the return of the strategy over a given year).
Figure 2: Distribution of Annual Reference Class Returns: Verdad vs. the S&P500 and Nikkei 225

Source: Verdad research
When combined into a portfolio, the returns look even more attractive. In 51% of the years in our sample time frame, Verdad’s strategy returns >20%, while broader indices achieve >20% returns in only 23% of the years in the sample. Both Verdad and the broader indices have negative returns in about one-third of the years in the time frame, with Verdad’s strategy having steeper drawdowns then the public markets. The Verdad strategy underperforms in 32% of the years, but the returns distribution is skewed such that the outcomes are much better for Verdad than the broader indices. The S&P500 and the Nikkei have an annual average return of 5% versus the Verdad reference class at 19%.
By combining portfolios of stocks that are more volatile and have a steeper sloped returns distribution, we are able to generate consistently higher returns than broader markets.
Step 3: Use specific information about the individual case to adjust the prediction
With that research done, we choose which stocks to invest in not based on individual case-by-case analysis but rather by evaluating how well a given stock fits in with the reference class we’ve established. We use algorithms, both linear regression models and machine learning models, to effectively identify the stocks that fit our reference class.
Once we have a list of the securities that fit within the parameters of the reference case, we analyze each security to adjust the prediction based on case-by-case information. For example, we might have a different forecast for a company that sells tubular goods to the U.S. shale drilling market than for a company that provides enterprise telephony to the S&P500 on long-term recurring contracts (we could improve our forecast for the former by looking at long-term histories of oil prices and comparing that history with the break-evens for U.S. shale).
We would note that we differ from purely quantitative investors on this point. We do believe that fundamental analysis of individual securities can improve forecast accuracy and that the eyes of a well-trained security analyst can find things that broad reference class models might miss.
We use specific information about a given stock only at the end of the process to adjust the baseline prediction, relative to traditional equity managers who start from specific information and build out their forecasts without reference to a base rate.
The bottom line difference between our approach and traditional active management? Our forecasting strategies are actually proven to work…