Where are We in the Credit Cycle?
Investors in high-yield bonds and leveraged equities make a tradeoff: earn higher returns in exchange for taking on the risk of default.
The most significant factor driving returns in these asset classes is the ability of companies to refinance. As long as companies can refinance their debt easily, the risk of default is low. But in credit crises, when refinancing is difficult, there can be waves of defaults.
A groundbreaking paper out of Harvard Business School suggests that the best predictor of returns in the high-yield bond market is the credit quality of corporate debt issuers. During credit booms, low quality credit becomes an increasingly larger share of the aggregate quantity of debt issued. This low quality debt accumulates, posing risks to the financial system in total. In contrast, during bad economic times, low quality issuers default and only high quality issuers are able to borrow.
The Harvard researchers’ preferred metric for measuring issuer quality is the share of corporate bond issuance with a high yield rating from Moody’s. This metric is high when low quality firms are disproportionately issuing debt.
Figure 1: Credit Market Sentiment: The High Yield Share

Source: Harvard Business School Behavioral Finance and Financial Stability Project
This metric peaked in September of 2014 at 51% — a level previously reached in the middle of 2010 before the European debt crisis, in 2004 in the middle of the credit bubble, in 1997–1998 during the tech bubble, and during 1988 and 1989 at the height of the junk bond frenzy.
But now, in late 2016, we find ourselves in an ideal time in the credit cycle. The long-term average high-yield share is 33%, with a standard deviation of 15%. The high-yield share has been below average since December of 2014 and reached a low of 18% in March of 2016 — the lowest share recorded since March of 2009.
The Harvard paper finds a “striking degree of predictability” in future excess returns in the bond market using this metric of high-yield share. Below is a table from the paper that supports the relationship. The left axis shows issuer quality, with higher numbers indicating lower quality issuance and lower numbers indicating higher quality issuance. The right axis shows excess returns to high-yield bonds over the subsequent two years, with returns plotted on a reverse scale to show the inverse relationship.
Figure 2: Issuer Quality vs. Excess High Yield Return
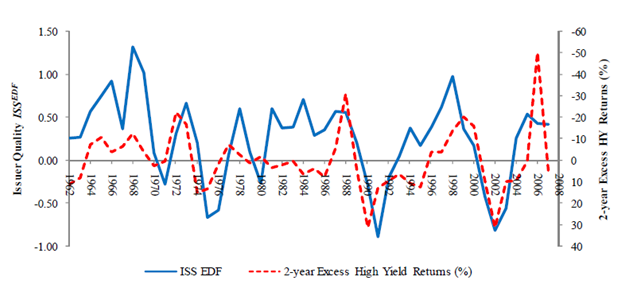
Source: Greenwood and Hanson, “Issuer Quality and Corporate Bond Returns”
We believe this is important for Verdad, because our strategy is highly correlated to the high-yield corporate debt market: when the high-yield market is doing well, our strategy has the potential to significantly outperform broader equity markets. To paraphrase Metternich, when the high-yield bond market sneezes, leveraged equities catch colds.
Right now, we are in the early stages of a rally in high-yield debt. The quality of high yield credit issuance is historically high. Credit spreads are falling from 5-year highs reached this winter. The road ahead looks clear.