What Happens in an LBO?
At the peak of the private equity (PE) boom in early 2007, Cerberus Capital Management announced that it was buying Chrysler from DaimlerChrysler for $7.4B. The New York Times described Cerberus as a “private equity firm that specializes in restructuring troubled companies.”
“As a private company, Chrysler will be better positioned to focus on its long-term plan for recovery, rather than just short-term results,” Chrysler’s chief executive, Thomas W. LaSorda told The Times.
Conventional wisdom had it that the sharp businessmen at Cerberus could slash costs and return Chrysler to growth — that by making the company private, they could take the difficult steps necessary to transform it.
A mere two years later, the company filed for Chapter 11 bankruptcy — the turnaround had failed. The financial crisis had sent the company into a tailspin, and Cerberus was derided for its very public failure.
Many critics of PE tell stories like this to demonstrate the rapaciousness of PE capitalism — the hubris before the fall, the stripping of assets, the inevitable bankruptcy.
I tell the story for a very different purpose: to investigate whether PE can succeed in restructuring companies and orienting them toward long-term growth rather than short-term results.
This PE industry relentlessly markets this line. Blackstone, the PE giant, advertises on its website that it makes money “by investing in great businesses where our capital, strategic insight, global relationships, and operational support can drive transformation and realize the company’s potential. The resulting improvements in growth and global competitiveness benefit not only investors, but also workers, communities, and all stakeholders.”
And at some level, this makes sense. Why else would Blackstone buy the entire company instead of just a minority stake? Presumably because they think they can run the business better than the current management team.
But do PE firms truly improve growth and competitiveness? What impact do these firms really have on the businesses which they invest in?
* * *
This might seem like an unanswerable question. After all, PE firms take their companies private, hiding their financials from the public. The industry would have us believe that the proof is in the pudding — that their return out-performance proves they are better managers who drive superior growth and produce superior outcomes.
But there is, actually, a way to answer the question. As it turns out, many PE firms issue debt to finance acquisitions and, in those cases, the firms are required to provide investors with the company’s financials. These financials can be used to compare a company’s pre- and post-acquisition performance to determine exactly what the PE firms achieve.
We took that information and compiled a comprehensive database of 390 deals, accounting for over $700B in enterprise value, a substantial set of data representing the majority of the largest deals ever done. We then analyzed it to understand what has actually been going on in the PE industry.
We wanted to put each of the industry’s core claims to the test. In their portfolio companies, firms like Blackstone claim accelerated growth, more efficient operations, a superior capital structure, and the ability to make long-term investment decisions public companies may not be able to make.
If these claims are true, we should see results in the financials of the portfolio companies, such as accelerated revenue growth, expanded profit margins, and increased capital expenditures. But the reality is that we see none of these things — what we do see is a sharp increase in debt. Below are four graphs that show key pre- and post-acquisition financial metrics for the data set of businesses we examined. In these graphs, T represents the year of the transaction, with T-1 representing the previous year and T+1 the year subsequent to the transaction.
Figure 1: Revenue Growth
This table shows the median year-over-year growth in overall sales for the companies that were acquired by private equity firms.

Source: Capital IQ.
Figure 2: EBITDA Margin
EBITDA, or earnings before interest, taxes, depreciation, and amortization, is the most commonly used profit metric in the private equity industry. This graph shows EBITDA as a percentage of sales, and is a measure of profitability and efficiency.

Source: CapitalIQ.
Figure 3: Debt/ EBITDA
This table shows the ratio of debt on the balance sheet to EBITDA.

Source: CapitalIQ.
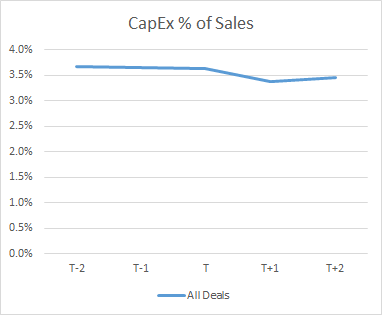
Figure 4: CapEx as % of Sales
CapEx, short for capital expenditure, is the money a company invests to grow the business by purchasing new assets, like factories or property. Below I show the median percentage of sales that these firms spent on capital expenditures pre- and post-acquisition.
Source: CapitalIQ
These four graphs represent a departure from the industry narrative.
Most industry participants and public observers believe that PE firms can grow businesses faster than the markets by making long-term investments. But these charts show growth declining sharply immediately post acquisition and, not only is revenue growth declining, but the firms are spending a significantly lower percentage of sales on capital expenditures.
And while PE firms are typically praised for their efficiency and cost-control, the chart on EBITDA margins shows a negligible difference in actual profitability — the supposed efficiency and cost-cutting isn’t showing up in the numbers.
In 54% of the transactions we examined, revenue growth slowed. In 45% margins contracted, and in 55% capex spending as a percent of sales declined.
PE firms don’t seem to be growing businesses faster, investing more in growth, or gaining much operational efficiency. So what are these PE firms doing?
In 70% of cases, PE firms are leveraging up the businesses they buy. Table 3 shows that PE firms typically double the amount of debt on the balance sheet, from 2.5x EBITDA to 5x EBITDA — the biggest financial change apparent from our study.
The industry mythology of savvy and efficient operators streamlining operations and directing strategy to increase growth just isn’t supported by data. Instead, there is a new paradigm to understand the PE model — and it’s very, very simple.
By and large, and as an industry, PE firms take control of businesses to increase debt and redirect spending from capital expenditures and other forms of investment toward paying down that debt. As a result, or in tandem, the growth of the business slows. That’s a simple, structural change, not a grand shift in strategy nor a change that really requires any expertise in management.
This study is not the only one to come to this conclusion. A 2013 study by researchers at the University of Texas concluded after investigating 317 LBOs, "We find little evidence of operating improvements subsequent to an LBO... Our results suggest that effecting a sustained change in capital structure is a conscious objective of the LBO structure."
* * *
Investors should not take the industry’s word that PE firms are superior managers that drive superior performance at the firms they own — this is a myth akin to arguing that Republican presidents are better for the economy or Democratic presidents are better for the poor. It sounds plausible, but it’s very hard to prove with data. And investors should be motivated by data, not myths. As we have shown, this data is both easy to obtain and analyze. Ultimately the burden of proof is on the PE firm — if they claim to drive operational change, then let them prove it. Until then, assume that the base rate is as described above — a systematic leveraging up of businesses, resulting in slower growth and less money to spend on capital investments.
There are, of course, some PE firms that really do add value. The following is an example of companies that were acquired by a PE firm that actually did enact operational change. It illustrates how clear and easy it is to measure operational change when it is actually occurring.
* * *
In early 2013, the Brazilian PE firm 3G, backed by Warren Buffett, took control of Heinz, the great American ketchup company.
The new owners invited the company’s top management to a retreat in San Francisco. After a pep talk about what Heinz would become, the new Brazilian CEO, Bernardo Hees, invited each of the firm’s top executives in for a 15-minute interview. In the interview they had to answer three questions: What have you done for the company? How can you prove that with financial metrics? What suggestions do you have for the company?
On the basis of those 15-minute interviews, Hees fired 11 of Heinz’ top executives, replacing them with 3G loyalists. Hees then sold the company’s corporate jets, created an open floorplan office where everyone works on tables in one big room, encouraged corporate employees to wear clothes with the Heinz logo, and went on a massive cost-cutting binge.
Heinz quickly fired 350 of the 1,200 corporate staff in Pittsburgh and informed all suppliers that they would need to dramatically cut prices if they wanted to maintain Heinz’ business. 3G imposed its famous zero-based budgeting approach — requiring managers to justify each and every cost rather than simply basing the budget on the prior year’s budget. This resulted in draconian cost controls that limited the number of pages employees could print, restricted employees to a maximum 100 business cards per year, reduced per diems to $45 per day, required even executives to stay in budget hotels, and eliminated unnecessary functions.
3G has grown famous within the PE industry for their cost-cutting abilities, having executed the same playbook at Anheuser Busch InBev, Burger King, and then Heinz — their methods work.
Below, we show the same four charts we used to analyze the industry as a whole. These feature data from the Burger King and Heinz buyouts, where the relevant financial information is available.
Figure 5-8: 3G Revenue Growth, EBITDA Margins, Debt/EBITDA & CapEx as % of Sales


Source: CapitalIQ
Two of these tables look very similar to the typical PE story: Revenue growth and capital expenditures as a percentage of sales drop.
But the other two graphs look quite different. First, 3G dramatically improves EBITDA margins — increasing profits by one-third — entirely through cost-cutting. As a result of this dramatic expansion in EBITDA, the debt load, as measured by debt/EBITDA, comes down sharply, from significantly above industry levels down to the average for PE buyouts.
Looking at this data, we can see a clear connection between 3G’s claims to operational improvements and the actual financials of their acquisitions. They are indeed skilled at cutting costs and growing EBITDA, even as they suffer from the typical PE drop in revenue growth.
The PE industry has created an effective and pervasive marketing myth — that they are superior to individual companies, operating more efficiently and earning greater returns. But, as we have seen, this is largely fiction. The real reason PE firms want control of the companies they buy is not because of superior strategic insight, but because they want to significantly leverage them. There are, of course, exceptions, and we have offered a clear methodology for evaluating the claims of these firms and separating the wheat from the chaff.