What Drives Stock Prices?
We spend most of our research hours focusing on predictive signals, but this week we wanted to look back and see what factors have been responsible for the observed movements in stock prices.
For this initial analysis, we looked at the stock price performance (adjusted for dividends) of every stock traded on NASDAQ or the NYSE from 12/31/2014 to 12/31/2015. We then looked at how the change in six key financial metrics during 2015 explained that price performance: whether the company’s EBITDA and revenue grew faster than the median company, whether the company paid down debt, whether the company paid dividends, whether the company did material M&A, and whether the company bought back shares.
Below, we show a regression of stock prices against these key financial statement metrics.
Figure 1: Regression of 2015 Stock Price Movement vs. Financial Statement Metrics

Source: CapitalIQ, Verdad analysis
The regression ranks the factors by their statistical significance (the “t Stat”), and the coefficient shows the power of each variable. The regression thus shows that on average growing EBITDA at a higher rate than the median company was worth a 12.8% improvement in share price, paying down debt was worth 10.1%, growing revenue faster than the median company was worth 9.0%, and paying dividends was worth 3.1%. M&A and share buybacks were not statistically significant drivers of share price performance as you can see from the P-values being higher than 5%.
It is not enough to know what matters, however. We also need to know what is predictable ex ante. If an important ex post explanatory variable isn’t predictable ex ante, it’s not helpful to an investment strategy. Think of buying lottery tickets: the most important explanatory variable ex post is having the correct lottery ticket number, but before acting based on that, we need to know how likely it is that one is able to predict the right number.
We used persistence as a proxy for predictability. For example, 50% of companies with EBITDA growth above the median in one year grow EBITDA faster than the median in the following year. We give EBITDA growth a 0% predictability score because persistence is not a better indicator than random chance. Revenue growth is slightly more predictable, at about 60% persistence of above median growth. Debt paydown is the most predictable, at about 70% persistence. We took our predictability data for revenue and EBITDA from Louis Chan, Jason Karceski and Josef Lakonishok’s important paper “The Level and Persistence of Growth Rates” and we took the predictability of debt paydown from our paper “Forecasting Debt Paydown Among Leveraged Equities: Analysis of US Stocks from 1964-2012.”
In the below graph, we show predictability on the x axis and impact on share price performance on the y axis.
Figure 2: Importance x Predictability
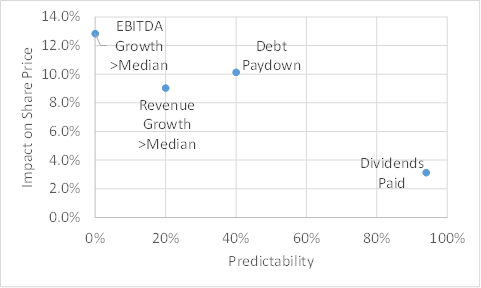
Source: CapitalIQ, “The Level and Persistence of Growth Rates,” “Forecasting Debt Paydown Among Leveraged Equities”
If you multiple predictability by impact on share price, debt paydown is the top factor at 4.1%, dividends rank second at 2.9%, revenue growth above the median ranks third at 1.8%, and EBITDA growth—because it is completely unpredictable—scores worst at 0%.
Given how important debt paydown is to driving share prices, and how much more predictable it is than revenue growth or EBITDA growth, we are shocked that we are the only fund, that we know of, to explicitly focus on deleveraging as a source of equity alpha.