The Lure of Venture Capital
In 1997, venture capital firm Benchmark, then managing about $85M, invested $6.7M in a small online auction company named eBay. By the spring of 1999, that small stake was worth $5B. Union Square Ventures’ first fund, a $125M vehicle raised in 2004, returned 13.9x cash-on-cash return off investments in startups like Twitter and Zynga.
Silicon Valley buzzes with these types of stories, of fortunes made on savvy early investments in companies that would go on to disrupt entire industries. And investors from all around the world compete to deploy capital with those few venture capitalists who have shown the Midas touch by investing early in a future unicorn.
But are these stories representative of the broader industry? Or is venture capital the rich man’s lottery, a market that has made a few very public fortunes but been a cash drain for the masses? We set out to explore the data on venture capital returns to answer these questions.
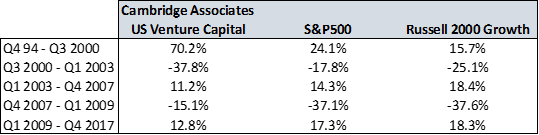
We started by comparing the returns of Cambridge Associates’ Venture Capital Index to public equity indices, both the large-cap S&P 500 and the more comparable small-cap growth index, the Russell 2000 Growth. Cambridge Associates data shows that venture has underperformed public equity benchmarks on a three-year, five-year, 10-year, and 15-year horizon.
Figure 1: Cambridge Associates Benchmarks

Source: Cambridge Associates
The only multi-year periods when venture capital outperformed comparable public equity benchmarks were the tech bubble leading into 2000, and the 2007–2009 period when venture capital funds didn’t mark their investments down to the same degree as public equity markets.
Figure 2: Venture Capital Performance by Sub-Period (Annualized Rates of Return)
Source: CapitalIQ, Cambridge Associates
Venture has been a losing bet relative to public equities for decades. Part of the reason venture struggles is that the vast majority of venture capital investments lose money, while only a very small percentage have the lottery-winner positive returns that dominate the headlines.
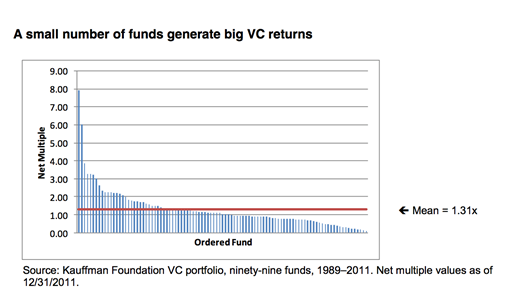
Figure 3: Right-Skewed Distribution of US Venture Returns

This dispersion of returns of individual investments means that a small number of venture capital firms have put up truly spectacular returns while the majority have had mediocre outcomes at best.
The Kauffman Foundation completed a review of the their venture capital portfolio, studying the 100 VC funds they have invested in since 1989. They found that while the average return on their funds was only 1.31x, several outliers produced many multiples of that return.
Figure 4: Distribution of VC Returns
One study conducted by a fund-of-funds investment manager revealed that, from 1986 to 1999, a mere 29 funds raised 14 percent of the capital in the industry but generated an astonishing 51 percent of total distributions—about a 3.6x multiple. The Kauffman Foundation concluded that “generating great VC returns requires access to the small group of best-performing funds.”
But there are two problems with that strategy. First, picking the best VC fund is nearly as challenging as identifying great startups: a very small set of funds beat the public markets while the vast majority do not. Second, there is a correlation between fund size and returns: the very best performing funds have generally been small, meaning a smaller number of allocators knew about or believed in the manager at the time the fund was raised.
Figure 5: VC Fund Returns vs. Size

Taken together, these data suggest that venture capital is the most extreme example of private market investments underperforming public market investments. The whole asset class has consistently lagged public equity benchmarks. And the odds of LPs choosing the right VC funds, the big winners that generate the majority of the return, are extremely low—a task as challenging as identifying the best startups.