The Dispersion Delusion
Private equity’s return dispersion is the same as public stocks with similar characteristics.
By: Brian Chingono and Dan Rasmussen
Advocates for private equity investing often note that the dispersion of performance between top-quartile managers and bottom-quartile managers is significantly wider than the range of performance in liquid asset classes.
The implication is that private markets are less efficient, that there’s a larger role for skill, and that investors in private equity can take advantage of this dispersion through manager selection. “Manager selection is critical to strong returns, perhaps even more so in alternative investments,” J.P. Morgan argues in their Guide to Alternatives. “Dispersion in performance is pronounced in non-core real estate, private equity, venture capital, and hedge funds, underscoring the importance of choosing an effective manager to unlock the return-enhancing potential of alternatives.”
But we think this argument might be oversold. We’ve noted before that investors with large PE portfolios tend to experience a bell-curve distribution of manager performance, with less than 20% of managers falling into the top quartile. In a recent paper, researchers from the University of Chicago, Oxford, and UVA found that buyout firms who report top-quartile performance while fundraising have little to no persistence in remaining top-quartile in their subsequent fund. This means that “investors gain little by knowing the relative performance of the current fund when deciding whether to commit to the next buyout fund being raised by the same GP.” If wide dispersion in PE is attributable to high skill, then either those talents don’t persist across funds, or they cannot be recognized at the time of fundraising (although to be fair, there was one category where skill persisted among buyout mangers, and that was in the bottom quartile).
We think a more plausible hypothesis is that this dispersion reflects differences in portfolio composition between private equity and public funds. Private equity portfolios are quite different from mutual fund portfolios. First, private equity portfolios tend to have about 20 firms, whereas a typical mutual fund holds about 200. Second, private equity portfolios are overwhelmingly comprised of micro-caps, while most mutual funds focus on large- and mid-caps. Even the median small-cap mutual fund holds companies with market caps about 10x the size of a typical LBO. Third, private equity funds hold highly levered companies, with the median proportion of debt financing being 49% Net Debt/EV and the median leverage ratio being 4x Net Debt/EBITDA.
It's also worth noting that PE funds have widely variable holding periods, with funds buying companies over a 3-5 year investment period, holding each company for 3-5 years, and then exiting.
The differences between the type of companies that private equity funds own and the type of companies that dominate public equity indices are substantial. Approximately 20% of US private equity funds are below $50M in size, and the median fund size is around $300M. Assuming PE funds have around 20 holdings on average, that would imply average equity checks of $1-3M among the smallest funds.
To create a public-market replica of the PE opportunity set, we built a levered micro-cap universe using S&P Capital IQ’s data on all US stocks from 1995 to 2022. To capture the radical size characteristics of private equity in our micro-cap universe, we set the minimum market cap at $5M and set the maximum at $2B. Minimum leverage for eligibility in the micro-cap universe is 30% Net Debt/EV. In comparison, our mutual fund universe contains both levered and unlevered companies, and the minimum market cap is $2B.
Figure 1: Median Characteristics of Micro-Cap Universe and Mutual Fund Universe (1995–2022)

Sources: Capital IQ and Verdad analysis
We can see the impact of each of these differences by creating simulations of public equity portfolios that vary in concentration, company size, and timing of investment. The simulations start by randomly selecting a vintage year between 1995 and 2017, then including the two subsequent years to form a three-year investment period. For example, if 2000 is randomly chosen as a vintage year, the investment period will comprise 2000, 2001, and 2002. Each investment within a portfolio is sold after being held for four years. This iterative process of portfolio formation and realization is repeated 10,000 times in our simulations to create a distribution of return outcomes.
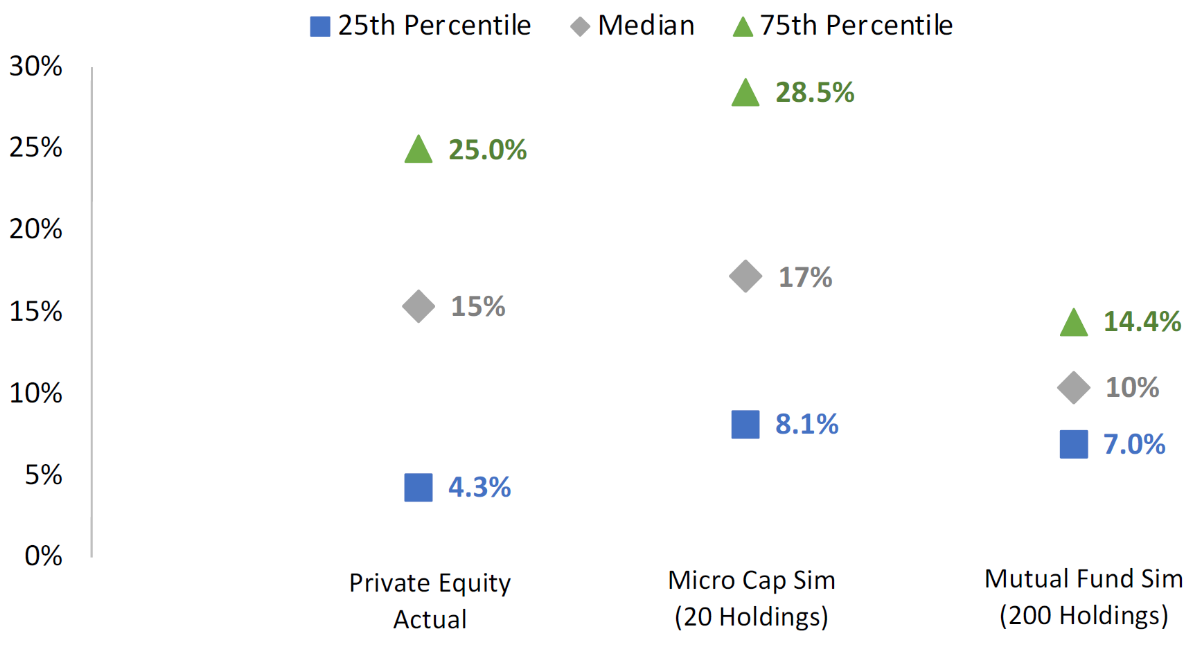
First, let’s compare dispersion among typical mutual fund portfolios (which hold ~200 positions and focus on stocks with >$2B of market cap) versus the dispersion of micro-cap portfolios with 20 positions. The dispersion between top- and bottom-quartile returns is 21 percentage points in private equity versus only 8 percentage points among the simulated mutual fund portfolios. But the micro-cap simulation shows dispersion of 16 percentage points, suggesting that concentration in micro-caps explains more than half (58%) of the difference between mutual fund dispersion and private equity.
Figure 2: Return Dispersion of Private Equity vs. Micro-Cap and Mutual Fund Simulations

Sources: J.P. Morgan Asset Management, Capital IQ, and Verdad analysis
In the simulations above, we assumed that all stocks are held for four years with equal amounts invested in each year.
So what other characteristics explain the remaining differential between private equity and mutual funds?
You will note from the above chart that median private equity returns are higher than the random simulation samples. We think this is because PE firms generally do not sample arbitrarily but apply some selection criteria. Below, we compare the median returns of private equity against simulated micro-cap portfolios of 20 stocks that are selected from the cheapest 5% and the most profitable 5% of companies within each year. Within our micro-cap data, there are typically 30-50 stocks in the top 5% of any given year, and the factor-ranked simulations randomly select from this opportunity set when forming the 20-stock micro-cap portfolios over the course of three years (at a pace of 6-7 investments per year). For context, there are over 2.3 million businesses with more than five employees in the United States. So if the private equity industry focuses on the top 5% of that universe, the PE opportunity set would have plentiful investment targets, with over 116,000 firms. This target list represents more than 6x the 18,000 firms actually owned by PE today. Therefore, we believe our 5% sampling provides a good representation of the opportunities available to PE.
Figure 3: Median Returns of Private Equity vs. Factor-Ranked Micro-Cap Portfolios

Sources: J.P. Morgan Asset Management, Capital IQ, and Verdad analysis. Value is a composite of EBITDA/EV, Sales/EV, Book-to-Market, and free cash flow yield. Profitability is defined as Gross Profit/Assets.
Value characteristics appear to have the biggest impact on micro-cap returns, boosting the median return from 10% in a totally random sample (as shown in Fig 2) to 18% in a value-ranked sample of 20 stocks. Quality also seems to matter, with an improvement of 4 percentage points in the median return from 10% in a totally random sample to 14% in a profitability-ranked sample of 20 stocks.
As University of Oxford professor Ludovic Phalippou has written, “Buyout funds mainly invest in small and value companies,” so we believe it’s important to account for both size and value characteristics when comparing private equity performance against public markets.
To test this, we ran our micro-cap simulations with an assumption that managers rationally choose to concentrate on their best ideas by selecting from the highest-ranked stocks within each year. Our simple ranking system prioritizes stocks that are cheaper, more profitable, and more likely to pay down debt. Hold periods are allowed to randomly range from 3 to 5 years, and the pace of capital deployment can vary over a three-year investment period. The results of our analysis are summarized in the chart below. We also included a simulation of mutual funds, which ranks on value and profitability but selects from a universe of larger companies (>$2B) that also includes unlevered firms. As a benchmark for pure factor exposure, simulation results are presented before fees.
Figure 4: Return Dispersion of Private Equity vs. Factor-Ranked Simulations
Sources: J.P. Morgan Asset Management and Capital IQ. Note that actual private equity returns are reported as net IRRs. Simulation returns are presented before fees as a benchmark for pure factor exposure.
Comparing the actual net IRRs of private equity against the micro-cap simulation, we can see that dispersion is about the same at 20.7% in PE versus 20.4% in the micro-cap simulation. Therefore, private equity’s dispersion is in line with the random outcomes we would expect to see from volatile portfolios of levered, cheap micro-caps. The most notable difference is that PE managers underperform their simulated benchmark by 2-4 percentage points per year (a difference which could easily be explained by fees). The implication of this result is that private equity’s value creation is not sufficient to overcome its fees, in our opinion. While PE may create value through deleveraging and other management decisions, those benefits appear to be fully offset by fees.
The factor-ranked mutual fund simulation—which selects from a different universe of larger firms, including unlevered companies—has lower dispersion and a lower median return. With a greater number of average holdings at 200, the diversification of mutual fund portfolios dilutes their factor exposure, contributing to lower dispersion.
So when comparing private equity against mutual funds, we think there are two main effects to consider. First is the universe effect, where the PE universe is dominated by micro-caps and all companies are levered. Second is the concentration effect, where the average private equity fund holds 20 firms versus an average of 200 holdings among mutual funds. These differences are visualized in Appendix A. Assuming managers concentrate on their best ideas (cheaper, more profitable companies), we find there is higher dispersion among concentrated portfolios relative to more diversified portfolios. This is primarily because concentrated portfolios have greater exposure to the extreme positive skew of the value factor.
Our results suggest that the dispersion in private equity can be fully replicated in public markets, provided that investors focus on buying cheap, levered micro-caps and hold them in a concentrated portfolio, similar to the portfolio construction in PE.
Appendix A: Dispersion at Varying Concentration Levels
To maintain similar selection odds across various concentration levels, the ranking threshold varies with the concentration level of each portfolio. The 20-stock portfolios are randomly selected from the highest-ranked 5% of the universe, whereas the 50-stock portfolios are randomly selected from the top 15% of the universe. The 100-stock and 200-stock portfolios are randomly selected from the top 30% and the top 60% of the universe, respectively. There are typically 600 – 1,000 stocks in the universe within each year.
Micro-Cap Universe Simulation (Factor-Ranked)

Source: S&P Capital IQ and Verdad analysis. Market cap <$2B and Net Debt/EV >30%.
Mutual Fund Universe Simulation (Factor-Ranked)

Source: S&P Capital IQ and Verdad analysis. Market cap >$2B; no minimum leverage.
Appendix B: Variable Investment Pacing and Hold Periods
We also tested a hypothesis that variable investment pacing and hold periods might explain differences in dispersion. Without ranking the stocks in our universe, we varied the hold periods and pace of capital deployment. Instead of assuming fixed four-year holds, the set of simulations below allow hold periods to randomly vary between three and five years. We also randomly vary the pace of capital deployment over the three-year investment period. As much as two-thirds or as little as 10% of a fund can be deployed within a single year of the investment period, subject to random variation within this range across our 10,000 simulation runs.
We can see below that varying hold periods and capital deployment doesn’t change the simulation results (relative to what we saw in Figure 2). Outcomes are almost identical, with dispersion of 8 percentage points among mutual funds and 15 percentage points among micro-caps.
Return Dispersion of Private Equity vs. Simulations (Without Ranking)

Sources: J.P. Morgan Asset Management, Capital IQ, and Verdad analysis.
It appears that, on its own, random variation in hold periods and capital deployment doesn’t affect dispersion outcomes. We believe that is because random changes get averaged out over a large sample of 10,000 simulation runs.
It’s also worth noting that, without ranking, the median return in the micro-cap simulation is around 9%, which is significantly below private equity’s historical median return of around 15% per year. The median valuation in the micro-cap universe is 9x EV/EBITDA. To the extent that private equity has shifted over the years from buying companies at mid-single-digit valuations to purchasing at double-digit valuations, we believe the above micro-cap simulation offers an indication of how PE’s return distribution may look in the future.