Size Matters, Part II: Evidence from Europe
Defending the British soldiers who had committed the so-called Boston Massacre, John Adams argued that the soldiers had acted in self-defense and deserved to be found innocent despite popular sentiment. “Facts are stubborn things” he said. “Whatever may be our wishes, our inclinations, or the dictates of our passion, they cannot alter the state of facts and evidence.”
While we might wish that large funds could focus on the best opportunities in the market, while we might be inclined to think that there is no trade-off between fund size and returns, and while the dictates of our passion might lead us to attribute investment success to a manager’s skill rather than to systematic factors, the facts are stubborn.
As we demonstrated last week, the major structural advantage that smaller funds have over larger funds is that they have a broader opportunity set. Simply, there are far more small-cap stocks than large-cap stocks. Below is the distribution of public companies by market capitalization in Europe. A fund manager who is constrained to investing in large cap stocks would miss 78% of the opportunity set.
Figure 1: Market Cap Distribution in Europe (June 2018)

Sources: S&P Capital IQ and Verdad analysis.
The opportunity set in small-caps is also more attractive than in large caps because there is much wider dispersion in small-caps relative to large-caps. We know, for example, that valuation metrics like Price/Book, EV/EBITDA and EBITDA yield (EBITDA divided by market cap) reliably predict returns. Below, we show annual returns for all European stocks sorted by valuation metric.
Figure 2: Returns by Valuation Decile in Europe (July 1997–June 2018)
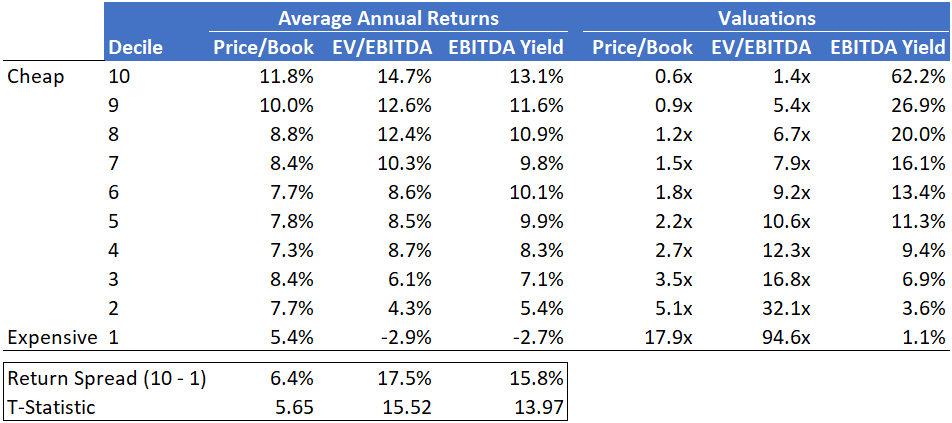
Sources: S&P Capital IQ and Verdad analysis.
The cheapest decile of European stocks has outperformed the most expensive decile by anywhere between 6.4% and 17.5% per year since 1997. However, most of this value premium is attributable to small companies. Figure 3 shows the difference between the average annual returns of the cheapest decile of stocks and the most expensive decile of stocks, split by large-caps and small-caps. As you can see, the value premium is much higher and more reliable among small-caps.
Figure 3: Return Spreads by Size (Left) and their Statistical Reliability (Right), July 1997–June 2018

Sources: S&P Capital IQ and Verdad analysis.
And why is the value premium more robust among small stocks? Because the cheapest stocks within the small-cap segment tend to trade at a discount to the cheapest stocks within the large-cap segment. Figure 4 illustrates this point by comparing the cheapest 20% of small-cap stocks (small value) against the cheapest 20% of large-cap stocks (large value) between 1997 and 2018.
Figure 4: Small Value Stocks are Cheaper than Large Value Stocks (July 1997–June 2018)

Sources: S&P Capital IQ and Verdad analysis. Small value is defined as the cheapest 20% of small-cap stocks. Large value is defined as the cheapest 20% of large-cap stocks.
So what does this mean for the returns of a fund relative to its size? To achieve higher returns, a fund manager has to be willing to stay small in order to concentrate on the cheapest small-cap stocks with lower trading volume. Figure 5 illustrates this point through backtests of value strategies at various levels of portfolio concentration and liquidity. Although these backtests do not reflect Verdad’s strategy of targeting leveraged small value equities, the conclusions regarding fund size and returns are similar in our strategy. Value strategies that were more concentrated and focused on smaller, less liquid stocks had higher returns and Sharpe Ratios between July 1997 and June 2018.
Figure 5: Value Strategies in Europe (July 1997–June 2018)

Sources: S&P Capital IQ, MSCI, and Verdad analysis.
We can also estimate the capacity of each value strategy, based on the minimum trading volume of its holdings. Strategies that hold less-liquid stocks will have lower capacity. Then we can calculate the excess return of each value strategy relative to the MSCI Europe Small Value Index. Figure 6 presents the results. The evidence points to a negative relationship between fund size and outperformance over a benchmark. This pattern of declining returns to scale appears to be a “stubborn fact” indeed for those who wish to generate significant excess returns from billion-dollar funds.
Figure 6: Higher Capacity Strategies Have Lower Excess Returns (July 1997–June 2018)

Sources: S&P Capital IQ, MSCI, and Verdad analysis.
Also note that the excess returns presented in Figure 6 are not the result of investment skill. Rather, they come from a stronger dose of the value factor among lower-capacity strategies. One could think of the small, low-capacity strategies on the left of Figure 6 as purveyors of straight gin and the big, high-capacity strategies on the right as purveyors of gin and tonic, plenty of tonic.
The implications for investment skill are inescapable. Eugene Fama and Ken French have demonstrated that it is exceptionally difficult to separate luck from skill when evaluating a fund manager’s past performance. To the extent that a manager has outperformed their benchmark over a long horizon, it is usually better to assume that they provided stronger doses of some factors (e.g. value, profitability, or momentum) relative to the benchmark, as opposed to attributing their outperformance to skill.
But as a fund gets bigger and more diversified, its dosage of factors gets watered down. So if an investor wants a strategy that offers an excess return above 2% per year, they would be better off focusing on small funds with less than $200 million of capacity, as suggested by Figure 6. No skill would be required from the managers beyond the discipline of staying small and sticking with their strategy.
Conversely, investors who wish to receive over 2% per year of excess return from billion-dollar funds would have to place a lot of faith in their fund manager’s skill.
The evidence presented in this article shows a clear relationship of declining returns to scale in fund management. We are not the first ones to point this out. Academic researchers have documented this relationship over decades and we will present a summary of those findings next week.