Replicating Our Debt Paydown Algorithm in Japan
Daniel Kahneman and Amos Tversky’s book, “Thinking, Fast and Slow,” is perhaps the most important breakthrough in our understanding of how our minds work in the past century. The studies upon which the book was based deservedly won the Nobel Prize in 2002.
At Verdad, we are building an investment firm on the basis of this new understanding. At the core of our approach is an empirically proven forecasting methodology that is far superior to the methodologies used by most fundamental investment shops. We rely on base rate analyses, and we derive those base rates by looking at long-term market data across multiple markets and multiple economic cycles.
Base rates are a concept from Bayesian statistics that are the best proven methodology for making accurate forecasts about future events (read Superforecasters, by Philip E. Tetlock and Dan Gardner to see in depth how base rates lead to dramatic improvements in forecast accuracy).
To understand base rates, take this example: Linda was an English major at Oberlin and her friends describe her as neat and organized. Is she more likely to be a nurse or a librarian?” Most people take the individual descriptions of Linda (English major, liberal arts college, neat, and organized) and say “librarian” but the better forecast would be to calculate the base rate of nurses and librarians in the country. There are 2.7 million nurses in the United States and only 143,000 librarians, so the base rate probability is 95% that she is a nurse and 5% that she is a librarian.
The field of machine learning is an automated way of discovering base rates in large samples of data — and thus an optimal tool for making effective forecasts. The way machine learning works is that the computer evaluates patterns within the data in order to identify the most statistically robust way of constructing base rates for out-of-sample prediction.
At Verdad, we designed a machine learning algorithm, trained on U.S. data, that can predict the probability of a company paying down debt. The algorithm takes every company’s financial data and uses that to provide a probability of debt paydown (e.g., Does company X have debt/enterprise value above 50%? If so, did company X repay debt in the previous year? If both conditions are met, the base rate probability of debt paydown is higher than if only one, or none, of these conditions is met).
Think of this model as quite similar to what credit card companies use to assess credit risk. These lenders don’t assign a team of staff to each applicant in order to model their future income streams, interview them, and determine whether they’re a good credit risk; credit card companies use sophisticated algorithms to do it in bulk with a much higher accuracy rate and much lower human workload.
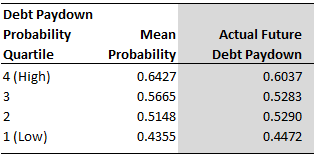
We do the same for businesses — assessing the likelihood of debt repayment in a systematic, proven, automated way. We trained our debt paydown algorithm on a sample of U.S. equity data from 1964 -2012, then we tested its effectiveness on a sub-sample of U.S. data that had been randomly held out of the original training stage. The table below shows the results our out-of-sample test in the United States. The 39,116 stocks in our out-of-sample test were assigned a probability of paying down debt over the next year by our algorithm. We then grouped these stocks into quartiles, according to their estimated debt paydown probability. The first column in the table below shows the quartiles, and the second column reflects the average probability assigned to the stocks within each respective quartile. The third column (highlighted in grey) shows the proportion of stocks that actually paid down debt over the following year, with each quartile. An important take-away from the table below is that the estimated probabilities in each quartile are generally in line with the actual results. The algorithm effectively predicts debt paydown in an out-of-sample test among U.S. stocks.
Figure 1: Performance of Verdad Boosted Trees Algorithm in the United States (N = 39,116)

We then applied the exact same algorithm to Japanese data. This provided an additional out-of-sample test within a foreign market. It is important to note that we did not retrain the algorithm with new data from Japan. We simply took the original U.S. algorithm and asked it to predict future debt paydown for all stocks in our Japanese data from 1991-2014. Note that the Japanese data has a lower sample size relative to the U.S. data. The table below shows the results of our second out-of-sample test in Japan.
Figure 2: Performance of Verdad Boosted Trees Algorithm in Japan (N = 2,931)
Based on these results, we believe that our algorithm is also able to effectively predict future debt paydown in Japan. We are thrilled by these results as they show that our research is replicable, our findings are strong, and that we can trust our mathematical models will work in the most important out-of-sample test — live trading in real-world markets.