Meme Stonks Revisited
Insights on Short Squeezes
To squeeze or not to squeeze, that is the question:
Whether 'tis wiser in the market to ignore
The siren calls of WallStreetBets,
Or to take arms against a tide of short sellers
And by coordinating, enrich oneself. To buy—to hold.
Figure 1: Stonks Go Up

Source: The internet
Roaring Kitty’s reemergence saw both GameStop and AMC shares more than double in a matter of days. But Roaring Kitty didn’t just affect these two stocks. Rather, there was a widespread sharp rally in highly shorted stocks generally—a phenomenon known on Wall Street as a “short squeeze.” To better understand this phenomenon, we identified highly shorted stocks and did a deep dive analysis into their performance.
We can measure short interest through several descriptors: available short borrow utilization, days to cover, borrow cost fee, and percentage of shares sold short relative to float. By aggregating these descriptors into a composite factor, we can get a generalized notion of how exposed each individual stock is to the “short squeeze” factor.
We find that stocks prone to short squeezes tend to be highly volatile, heavily traded, and smaller in size. The short squeeze factor is characterized by stable periods of modestly negative returns punctuated by bursts of significant positive returns during squeeze events. In other words, the short sellers are generally right about these stocks, but market dynamics can make holding those shorts extremely painful during certain periods. As detailed below, an equal-weight portfolio of 170 stocks most susceptible to short squeezes returned 32.7% in April 2020, driven by TSLA, and 22.5% in January 2021, led by GME.
Highly shorted stocks perform very differently on “squeeze” and “non-squeeze” days. Our analysis separates time periods into these two states based on the performance of our constructed short squeeze factor—days when returns to the squeeze factor are above or below 30 basis points. Approximately 2% of days since 2005 have qualified as “squeeze days,” whereas the remaining 98% of days have been “non-squeeze” days.
Figure 2: Average 1D FWD Return by Short Squeeze Ventile
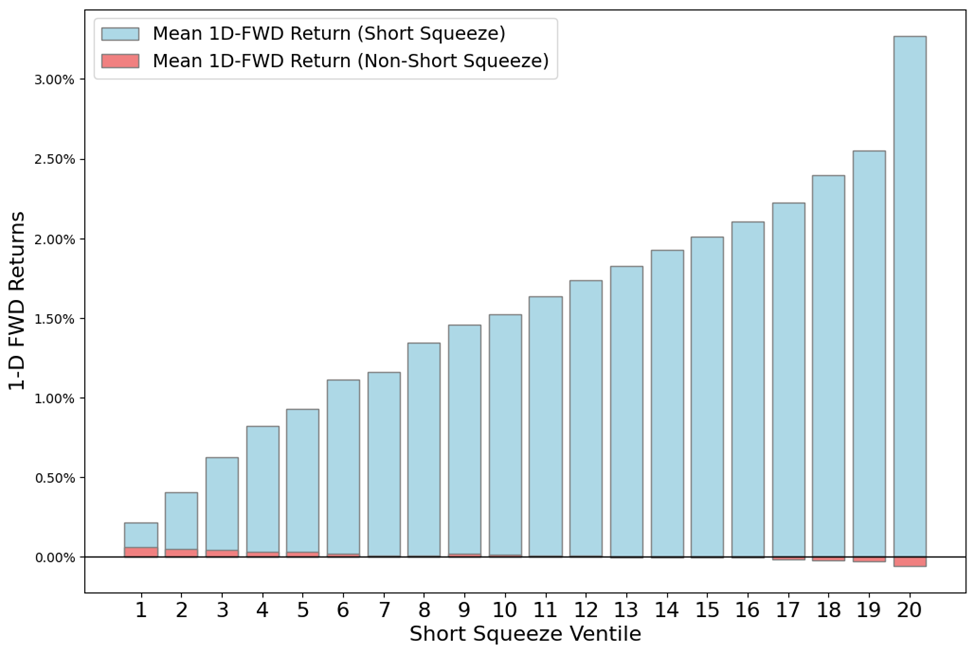
Source: Verdad analysis, Capital IQ
On squeeze days, returns increase with exposure to the short squeeze factor, spiking in the most extreme ventile. On non-squeeze days, the opposite is true. The stocks with the highest short squeeze exposure have the most negative returns. And the magnitude of the moves is massively higher on short squeeze days—just look at how much higher the blue bars are than the red bars, particularly in the most extreme ventile. This is consistent with the idea that short sellers are sophisticated and informed market participants, though dealing with these short squeezes is an occupational hazard. The fall of Melvin Capital reminds us that even a six-foot fund manager can find himself drowning in a river that has an average depth of three feet.
To see this more clearly, consider the performance of a monthly rebalanced, equal-weighted portfolio that consists of stocks from the highest short-squeeze factor ventile (top 5%). As shown below, this portfolio significantly underperforms the market over the long term but realizes extreme gains at the onset of significant short squeezes.
Figure 3: Cumulative Log Return of Highest Short Interest Portfolio

Source: Verdad analysis, Capital IQ
More broadly, portfolios with the highest short interest performed the worst on an absolute and risk-adjusted basis while those with the lowest short interest performed the best, as shown in the table below.
Figure 4: Performance Metrics by Short Interest Ventile

Source: Verdad analysis, Capital IQ
Short interest is generally helpful in predicting returns and Sharpe. One pragmatic application of a short interest factor for institutional investors is to go long companies with the lowest short interest, as suggested by the strong performance of the lowest SI portfolios. This result is supported by prior academic literature which finds that “heavily traded stocks with low short interest experience both statistically and economically significant positive abnormal returns.” There is far less risk to express a short interest factor bet by buying large, well-trafficked names rather than shorting small, idiosyncratic squeeze targets.
An illustrative sample of companies with high and low squeeze exposure is shown below:
Figure 5: High and Low Squeeze Stocks

Source: Verdad analysis, Capital IQ
While Roaring Kitty may come out to roar once in a while, the rest of the time, stocks with high short interest are more likely to whimper than roar. Without the ability to time or coordinate significant squeezes, we believe buying stocks with high short interest may prove periodically thrilling but results in a long-term losing strategy.