Glamorous Passive Investments
Passive index funds recently surpassed active managers with a greater than 50% share of US equity fund dollars, a seismic shift in the investment landscape.
This is an excellent outcome for investors. Index funds tend to charge much lower fees, be substantially more tax efficient, and, most importantly, outperform active funds in each category. According to data from SPIVA, over 80% of active managers underperform their benchmarks over a ten-year horizon.
Yet a variety of prominent hedge fund managers, from Seth Klarman to Bill Ackman, have decried this shift. Most recently, famed Big Short investor Michael Burry warned of a bubble in passive investing.
“The bubble in passive investing through ETFs and index funds as well as the trend to very large size among asset managers has orphaned smaller value-type securities globally,” Burry told Bloomberg news.
Is there any truth to these criticisms? Or is this just sour grapes from active managers who have struggled to outperform their benchmarks?
We are skeptical of the most common criticisms of passive investments. In general, we don’t think passive investing poses a risk to financial stability or to markets. That said, we do see a grain of truth in Michael Burry’s argument, although talk of bubbles seems overwrought.
The idea of index funds is that they own the same percentage of all stocks and thus are a passive reflection of the entire market. But that is not actually the case. Because investors choose which index funds to buy and which indexes to follow, passive index fund money favors a few glamorous passive indices. As of the end of 2017, for example, the largest provider of indices, S&P Dow Jones, had $13.7 trillion in assets benchmarked to its indices. But 72% of that was in the S&P 500 large-cap US equity index.
Vanguard offers 190 funds in the United States and manages about $3.2 billion in equity assets. The firm’s four largest funds account for $1.9 billion or 60% of assets. Two of these funds track the S&P 500 and account for over 20% of Vanguard’s equity assets. The largest focuses on the US equity market. As a result of this concentration, Vanguard as a firm is significantly overweight US equities versus international equities. The United States is 43% of total world market cap, but it represents 77% of what Vanguard has money in.
Figure 1: Vanguard vs. Total Market Cap by Region

Source: Capital IQ
Adding the two other largest index providers, State Street and Blackrock, tells the same story.
Figure 2: Big 3 Passive Providers vs. Total Market Cap by Region
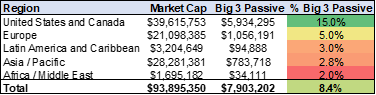
Source: Capital IQ
Passive money disproportionately flows to the S&P 500 and thus to large-cap stocks relative to smaller stocks. As you can see in the chart below, the big three passive providers are twice as represented in large growth stocks as in small value stocks.
Figure 3: Big 3 Passive Assets vs. Total Market Cap by Style

Source: Capital IQ
So Burry seems to be on to something in that US investors in passive indices have favored certain sectors of the market (large, US growth stocks) and disfavored others (international and small-cap stocks). And that favoritism is worrisomely correlated with valuations (we would note that we can’t prove a causal relationship). US stocks trade at a large premium to international stocks—nearly double the price-to-sales ratio of European and Asian stocks.
Figure 4: Valuations in the US vs. International

Source: Capital IQ
And this is also obvious by style. Large-cap growth stocks trade at nearly 5x the price-to-sales ratio of small value stocks.
Figure 5: Valuations by Style

Source: Capital IQ
The most popular choices for passive investors happen to be the most richly valued stocks in the market. We regressed valuations against a set of fundamental metrics like forecast revenue growth, margins, return on assets, and dividend yield. We then included region and inclusion in the S&P 500. We found that stocks that are in the United States—and specifically S&P 500 constituents—earn a premium over and above what their fundamental financial statistics would suggest.
As we have discussed before, these valuation spreads between US and international stocks and between growth and value stocks are near all-time highs—a worrisome sign for investors in the world’s most popular indices.
This should mean, in theory, that investors should earn significantly higher returns by owning small and international stocks. That hasn’t been the case for the past decade, so investors are skeptical of these arguments. But only a decade of bad returns could drive valuations this far out of whack.
And one of the most replicated findings in quantitative finance research is that popular assets that trade at high prices have worse returns than unpopular assets that trade at low prices. And the data suggests today that there are a few glamorous passive indices gobbling up more and more investor dollars, with the S&P 500 index in particular attracting investor capital at rates disproportionate to market capitalization.
Investors looking for alpha opportunities would do well to avoid the most popular trades and to look instead at areas of the market that have been neglected by current trends: smaller stocks, European and Asian stocks, value stocks. These areas have not been blessed with massive inflows from US passive equity investors, and valuations are significantly lower.