Explaining Private Equity Returns from the Bottom Up
Verdad’s investment strategy is premised on a few simple theses. First, private equity has dramatically outperformed broader equity markets. Second, leverage, size, and value together explain all of private equity’s outperformance. Third, investors seeking to achieve the historical returns of private equity are better off buying leveraged small value equities in the public markets than paying high fees to private equity firms that are buying companies at >10x EBITDA and using >5x EBITDA of debt to do so.
Though simple, these ideas are controversial. Private equity firms claim that their industry's outperformance is the result of investment skill, operational improvements, and an illiquidity premium. To many industry boosters, the idea that you could replicate what private equity firms do by simply buying small, cheap, leveraged firms in the public markets seems simplistic and maybe even a bit crazy.
I am delighted, therefore, that a groundbreaking new article in the CFA Institute’s flagship publication, Financial Analysts Journal, has provided significant new evidence for the accuracy of the Verdad thesis.
The authors of the piece, investors at the Canadian Pension Plan Investment Board and the Abu Dhabi Investment Authority, did a bottom-up analysis of 3,492 private equity transactions from 1993 to 2014 and concluded that “size and leverage are the key systematic risks to control for when comparing buyout fund returns and public market returns.” They argue that size and leverage together explain all of private equity's outperformance.
The authors first establish that private equity firms buy companies that are significantly smaller than broader public benchmarks. They found that the median size of buyout investments is very small, well below the average size of small-cap publicly listed companies. Only 15 private equity investments they studied were larger than the maximum market capitalization of the small-cap index (0.4% of the total). Below is their table showing the equity capitalization of private equity buyouts vs. the S&P 600 Small Cap Index and the S&P 500 index.
Figure 1: Size of Private Equity Investments

Source: Financial Analysts Journal
Second, the authors establish that private equity deals are significantly more leveraged than the typical public equity. They found that average net debt to enterprise value at inception has been approximately 65%, relative to about 35% for the average small-cap public company. Below is their chart showing leverage levels versus the small-cap index.
Figure 2: Net Debt/EV of Private Equity Deals vs. Public Markets
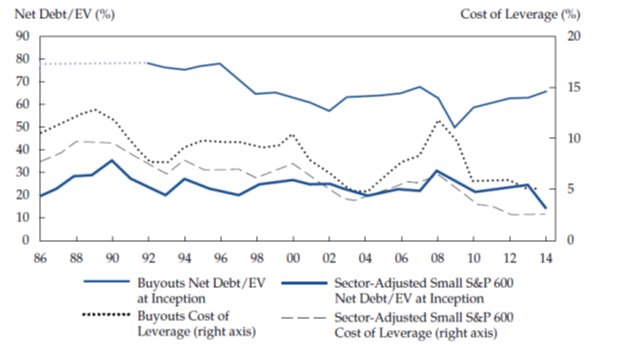
Source: Financial Analysts Journal
The authors find that adjusting for these two factors explains 50% of the outperformance of private equity. This comparison, however, assumes that each year receives an equal weight, which is not accurate because private equity firms’ capital deployment is pro-cyclical. Private equity firms deploy far more capital in certain years than others and those years have significantly worse performance than the years in which private equity firms deploy less capital. Below is a figure that compares private equity’s outperformance of the broader public markets with the amount of capital invested in each year.
Figure 3: Invested Capital vs. Public Market Equivalent (PME)

Source: Financial Analysts Journal
As you can see the PME, which measures the outperformance relative to public markets, is much higher in years of low capital deployment than high capital deployment. We have talked extensively about how this is the result of credit cycles.
The authors make a compelling case that private equity performance can be explained through size and leverage, but their study has a major drawback.
Their analysis does not take into account the far larger fee load private equity firms charge, which some researchers have estimated at 6% per annum. Private equity’s gross returns are therefore significantly better than the public markets. There is more to be explained, and the authors fail to explain that gap.
This gap can be explained easily by looking at value — private equity firms historically bought companies at much lower valuations than the broader public markets. Leverage amplifies the impact of valuation. Including leverage, as we did in our paper Leveraged Small Value Equities, explains the rest of the outperformance. In a footnote, the authors claim that the average EV/EBITDA for buyout transactions over the past 25 years, is about 11.8x EBITDA and thus conclude that the underlying companies of buyout funds are “value neutral.” This conflicts with every available data set on private equity purchase prices that we have ever seen (that show purchase multiples generally below 8x EBITDA, especially prior to 2005). The authors would do well to revise their analysis based on a more accurate picture of value.
Nevertheless, this paper is another confirmation of Verdad’s thesis. We believe investors should not blindly trust in private equity to achieve historical private equity returns, but rather they should study the factors that drove the outperformance in the past and rely on those factors to generate outperformance in the future. Those factors are size, leverage, and value, and this article in the Financial Analysts Journal does an excellent job of proving the importance of size and leverage.