Do You Believe PE's Reported Returns?
Private equity firms value their own companies and report those valuation marks to investors. Given that LBOs tend to be smaller and have more debt on the balance sheet than the average public company, the valuations should be more volatile. But looking at trends in historical marks, this has not been the case: the reported volatility of private equity has been about half that of the public markets.
Recently, academics have accused the industry of “return smoothing,” arguing that the marks seriously understate the volatility of the underlying assets.
Do you think private equity marks are fair and accurate representations of value or do the reported returns understate volatility and amount to returns smoothing that hides the risk of the underlying assets?
In this week's update, I share some data that informs my perspective on this question. I used Bison, a cloud-based private equity data provider, to pull up the 9/30/15 marks of all energy private equity funds raised between 2010 and 2013 with a minimum fund size of $500M. I then compared these marks to the absolute return of the S&P SmallCap 600 Energy Index, which includes all companies in the S&P SmallCap 600 that are classified as members of the GICS energy sector, which seems like the best public benchmark for these private equity funds.
I chose the energy sector because the precipitous decline of energy stocks gives us a good test case to see how private equity investors treat assets that seem likely to be less valuable than they were before.
Below are the statistics for the 2010, 2011, 2012, and 2013 vintage years. I show the name of each fund, the size of the fund, the reported IRR, the Multiple of Money (MoM), and the DPI (the ratio of capital distributed to capital paid in). DPI is useful as a measure of how objective or subjective the mark is: a low DPI means the fund’s carrying value is based primarily on subjective marks, while a high DPI suggests that more of the mark is based on actual capital distributed to LPs.
2010 Vintage Year

Source: Bison
On average, the 2010 vintage year has a DPI of 0.35x, which is the highest of any of the vintage years we’re looking at. But that leaves about 0.6x of the current mark unrealized. The IRR for this vintage is slightly higher than the public markets, while the multiple of money is 0.25x higher than the public markets.
2011 Vintage Year

Source: Bison
Here we see a dramatic divergence. While the S&P600 Energy index is down 50% from the beginning of 2011, amounting to a (13.7%) IRR, the private equity funds from the 2011 vintage are actually marked up on average to 1.13x MoM and a 5.5% IRR. Some of the biggest funds are marking their funds at 20%+ IRRs even with less than 0.3x DPI.
2012 Vintage Year

Source: Bison
Of the 2012 vintage energy private equity funds, KKR is the only fund to mark below 1.0x. Every other fund is, remarkably, reporting a positive IRR and a positive MoM, despite having an average DPI of less than 0.15x MoM and the comparable public benchmark dropping 52% over the investment time period. Somehow all of the private equity energy investors except KKR were able to buy highly leveraged micro-cap energy companies and make money while the public markets fell more than 50%. This is either one of the most brilliant coups in the history of investing, or the marks aren’t truly mark-to-market.
2013 Vintage Year
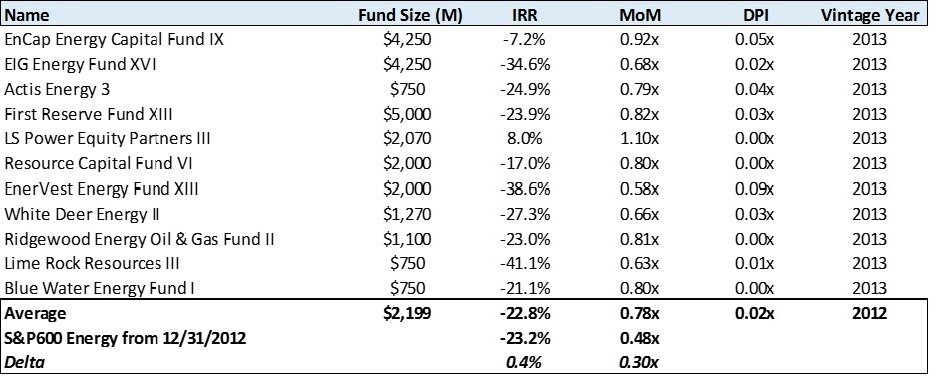
Source: Bison
Interestingly, though separated by only one vintage year, the 2013 funds tell a very different story than the 2012 vintage funds. These funds are all marked down with the exception of one fund that’s focused on utilities. While the S&P600 Energy index has fallen 52% from the beginning of 2013, these funds are reporting a drop of 22%, still significant outperformance, but at least in the same direction as the prices of public energy companies. This vintage year is also notable for having almost no DPI, meaning the marks are nearly entirely subjective.
Coming to your own conclusion
The S&P600 Energy Benchmark was essentially flat in 2012, before dropping 52% from 12/31/2012 to 9/30/2015. Yet somehow, the 2012 vintage private equity funds are almost all marked up in value, while the 2013 vintage private equity funds are all marked down, even though presumably the 2012 funds invested a higher percentage of their capital at the top of the market.
Bison analyzed the full data set of energy private equity funds and found almost no correlation between the price of oil and the quarterly changes in marks of these private equity firms.

Source: Bison
Roth gives a potential set of reasons why there would be no correlation: initial purchase prices being different in public markets than private markets, different debt levels, different hedging strategies, different business profiles, and portfolio diversification over several years. The other alternative is that the marks are not truly mark-to-market. The key question is: do you believe the marks? Are your private equity GPs telling LPs the truth? Or do you think there is return smoothing going on?