Credit-Driven Asset Price Inflation
How cheap money is driving overvaluation risk in public equity, PE, and housing
By: Philip Pilkington with Daniel Rasmussen & Greg Obenshain
Credit is the lifeblood of our economy. From consumer purchases financed on credit cards to home purchases funded by mortgages to equity investments made on margin and private equity funded by private credit, credit is a key driver of both prices and volumes. When debt is cheap and easily available, asset prices tend to rise; rising asset prices in turn make loans look safer, fueling yet more credit availability and more purchases.
Today, credit is extremely cheap and extremely accessible, and that is driving rising asset prices in three key markets: public equity markets, private equity markets, and housing markets. In each of these markets, rising asset prices are accompanied by decreasing loan-to-value ratios, falling debt costs relative to income, and, most strikingly, asset prices that look extremely high relative to history.
The Scylla and Charybdis of investing are bankruptcy risk and overvaluation risk, and when credit fuels rising valuations, investors should be doubly concerned. To navigate between these two dangers, investors need to be fully cognizant of the risks posed by rising asset prices and monitor credit markets avidly to look for signs of any change in credit conditions that might lead to a reversal.
In what follows, our goal is not to predict the next crash in any of these markets, or even to highlight definite bubble activity. Rather, we aim to highlight risks that we believe investors should be mindful of and understand that, by being invested in current markets, they are implicitly underwriting.
Public Equity Markets
The extremely low cost of borrowing has three primary impacts on equity markets.
First, companies issue more and more debt, swapping equity for debt and leveraging up corporate balance sheets.
Figure 1: Corporate Debt and Equity Issuance
Source: Federal Reserve, GMO
Second, unable to earn returns in credit markets or on cash balances, investors shift a larger portion of their investable assets into stocks.
Figure 2: Aggregate Financial Asset Allocation Among Household, Mutual Funds, Pension Funds, and Foreign Investors
Source: Federal Reserve Board, EPFR, Goldman Sachs
And as stocks rise, investors feel increasingly confident using margin loans to fund more stock purchases.
Figure 3: Margin Accounts at Brokers and Dealers
Source: Robert Shiller Website, Flow of Funds, BEA
Despite different methodologies, the three models are showing valuations only rivaled during the 1999 tech bubble. And these high valuations can only mean two things: either we are entering an era of extremely low expected returns on equity, or we are entering an age of extremely high earnings growth. The latter has been the story of the last decade in US markets, where technology stocks grew corporate earnings at an unprecedented rate. Today, technology shares are the biggest contributors to richly valued markets.
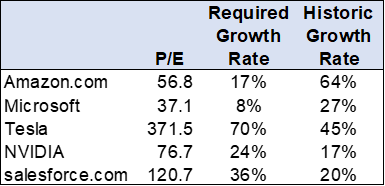
The below chart shows the companies most responsible for driving aggregate valuations higher. We compare their current P/E multiples, how fast earnings would have to grow over the next 5 years to earn a 5% return, assuming these multiples reverted to market average (33x P/E today), and each company’s trailing three-year net income growth.
Figure 4: Valuations and Growth
Source: Capital IQ, Verdad analysis
On their face, the required growth rates for Amazon and Microsoft look like they assume a slowdown, albeit to still high rates of revenue growth, while the required growth rates for NVIDIA, Salesforce, and especially Tesla are far higher than their already very high recent growth rates. But what’s clear is that high valuations are being justified by assuming companies that have achieved miraculous results over the past three years can continue those miraculous growth rates far into the future, something that very few companies have ever achieved.
But without such forecasts, investors would be left with assumptions that look like GMO’s seven-year forecast, essentially predicting zero or negative real returns on US equities given these starting valuations.
Private Equity and Private Credit Markets
One of the largest beneficiaries of easy credit has been private equity. Private equity has increasingly relied on private credit, as opposed to high-yield bonds or bank loans, to fund acquisitions. The below chart shows the rapid growth in private credit.
Figure 5: Private Debt AUM through 2020 ($ Billions)
Source: Pitchbook
Unconstrained by bank capital restrictions or CLO structure rules, private credit funds are free to make high-rate, high-leverage loans to borrowers on favorable terms. Most often, these funds are leveraged themselves. So long as risk premiums are falling, valuations are rising, and private equity exits are easy, this can work spectacularly well. In this environment, the hardest thing for the private credit firms is winning deals.
Cheaply available debt with minimal covenants has driven deal volume and valuations up, even as fund flows into the asset class have soared. The below chart shows deal volume, deal valuations, and debt/EBITDA levels over the past decade (we would note that these valuations are based on adjusted EBITDA and are likely ~25% higher on a GAAP basis).
Figure 6: US Private Equity Deal Volume, Valuations and Debt Levels
Source: Pitchbook. 2021 as of 9/30/2021.
As in public equity, investors in private equity know they can’t pay those prices for deals and put that amount of leverage on companies and expect strong returns in the absence of extremely high revenue and earnings growth. So private equity has shifted increasingly more money into technology and software, the one industry where such extreme growth projections are plausible based on recent history. Pitchbook reports that in 2021, about 40% of private equity deals valued at $1 billion or more were in the technology sector. And while it’s possible that technology companies will grow to justify these valuations, there’s no margin for error built into the market at these prices.
Many of these technology LBOs are only possible because of private credit. Many of these companies don’t have earnings, are burning cash, and have no assets, yet are taking on massive loans based on multiples of recurring revenue. “The sizable financing available from private credit is helping expand the scope of software or technology company transactions that PE can do,” the global head of Blackstone Credit told Bloomberg.
The most value-oriented—and credit-oriented—of the large the large private equity firms is warning of problems to come. “We are all in a state of collective delusion here,” Apollo’s co-president said at an industry conference. “We will look back in 20 years from now and say, ‘What were we all thinking? How is this really feasible that a buyout can happen at 25 times EBITDA?’”
Housing
Loose credit is also driving up the price of homes. Extremely low mortgage rates that are keeping mortgage interest relative to income near all-time lows. The below graph shows mortgage debt service payments as a percent of disposable income. Consumers simply have more borrowing power now when it comes to homes than they have on record in this data series.
Figure 7: Mortgage Debt Service Payments as a Percent of Disposable Income
Source: FRED
This is fueling an explosion of loans as people borrow more to take advantage of these low rates. And this surge in demand is being met by a dearth of supply. Active home listings in the US over the past five years are down dramatically, from over 1M per-pandemic to under 700,000 today. Both of these trends are exacerbated by the limited amount of new home supply since the 2008 financial crisis destroyed the home building industry. All in all, we see rapid rises in home prices driven by two main forces: extremely low mortgage interest costs and extremely low inventory.
In its well-reputed State of the Nation’s Housing report in 2021, Harvard’s Joint Center for Housing Studies advised that fears of a housing bubble are likely overwrought: “Conditions today are quite different than in the early 2000s, particularly in terms of credit availability. The current climb in house prices instead reflects strong demand amid tight supply, helped along by record-low interest rates.”
Housing valuations are at or close to historic peaks. Taken on their own, these valuations would have us concerned about the possibility of speculative pressure or bubble behavior in the housing market. However, given the supply-demand drivers outlined above, we believe that it is more likely that the current price trajectory will ease as home builders ramp up production and people return to rental buildings after the pandemic.
The best long-term series of housing market valuations are real house prices. On this metric the US housing market is now more expensive than at any point in history, including its previous peak in 2007.
Figure 8: Real House Prices
Source: Case-Shiller Website
The picture does not get much better if we compare house price to median household income. Whatever way you cut it, the standard valuation metrics are registering extremely high values in the US housing market. We can also drill down to the city-level data to see where prices are rising fastest.
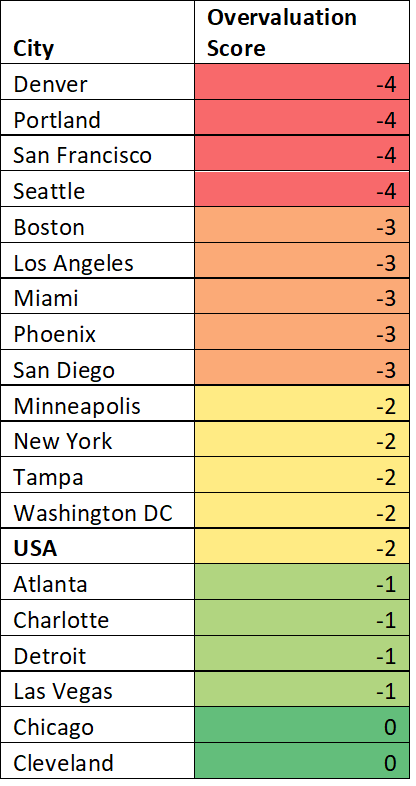
To do so, we applied a series of statistical tests to assign an overvaluation score to each of the 23 cities in the US that have their own index. The reading is based on standard deviation. The more negative a reading, the more the real house prices are deviating from their previous trend.
Figure 9: Home Price Deviation from National Trend
Source: Case-Shiller Website, Verdad analysis.
Most of the cities that publish separate indices are experiencing housing market overvaluation. The US as a whole, which, as we have seen, is more expensive than at any time in history on a real house price basis, only registers a -2 on our scoring system. Those cities that are registering -3 and -4 have housing markets that have inflated dramatically.
Conclusion
We have highlighted several risks that we believe to be present in the current environment. Many of these risks are the result of cheap credit. With inflation relatively high and market chatter about rising interest rates, we believe that investors should closely monitor these risks as they examine their portfolios. But one problem investors face is that while public tech companies could be easily sold if the tides turn, investors in illiquid private investments might have trouble exiting, which could create exacerbated pressures on valuations in private markets. We haven’t seen this type of risk come to fruition in the last 10 years—or even the last 20—but a careful study of history suggests deep caution about investments that combine high leverage with high valuations.
Acknowledgment: Philip Pilkington co-authored this piece. Philip is an Irish economist working in investment finance, most recently at GMO. He became well-known for his critiques of neoclassical economics and for his published writing in MoneyWeek and elsewhere.


