Capturing Excess Returns from Rating Changes
Anticipating upgrades and downgrades can improve bond and stock returns.
By: Brian Chingono & Greg Obenshain
In our previous two articles, we showed that upgrades and downgrades drive significant dispersion in bond returns—far beyond what can be explained by yield alone—and that machine-learning models can help predict upgrades and downgrades. This week, we explore the excess returns that can be captured by forecasting changes in credit ratings.
In terms of out-of-sample performance, the models we shared last week had predictive accuracy that outperformed random guessing by 1.8x in the top decile, with 43% accuracy in predicting downgrades and 38% accuracy in predicting upgrades.
To make these forecasts, our models rely on a range of signals that can be grouped into the following categories:
Price signals, including bonds’ market-implied rating
Momentum in the prices of bonds (and equity for companies that are also traded on the stock market)
Size measures, including total assets and total revenue
Leverage metrics, including companies’ total debt burden and their ability to service that debt
Profit margins
Accounting quality, including companies’ effectiveness at managing working capital
Based on these inputs, we believe our models are able to reliably predict upgrades and downgrades on new data, as we showed last week. But what does this mean for returns? Ideally, the upgrade model should generate its highest returns among bonds that are most likely to be upgraded. Conversely, the downgrade model should generate its highest returns among bonds that are least likely to be downgraded. And if we combine the upgrade and downgrade forecasts into a unified ranking, the highest-ranked bonds should outperform the lowest-ranked bonds. Importantly, the highest-ranked bonds should also outperform their yield if our models are capturing excess returns from future rating changes that have not been fully anticipated by the market.
All of these performance benchmarks were met when we evaluated the out-of-sample returns of the upgrade and downgrade models. First, the figure below shows the out-of-sample annualized returns of the upgrade model, by decile of upgrade forecast.
Figure 1: Out-of-Sample Forward 12-Month Bond Returns by Upgrade Forecast
(Dec 1996 – Aug 2020)
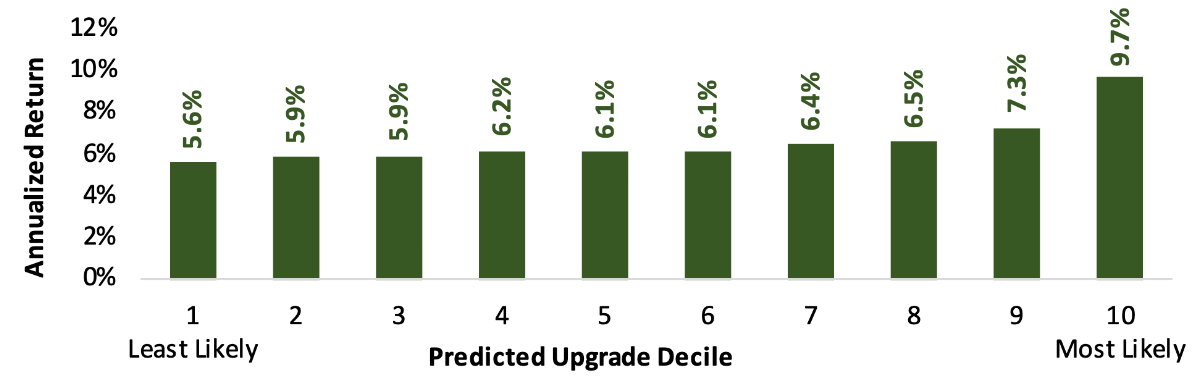
Source: Verdad Bond Database.
Over the 24 years since 1996, the top decile of bonds most likely to be upgraded has generated a 9.7% annualized return, outperforming the lowest decile by over 4 percentage points per year.
A similar spread can be seen in the returns from the downgrade forecasts, as shown in the figure below. Over the same 24-year horizon since 1996, the bonds least likely to be downgraded have generated an 8.7% annualized return, outperforming the worst decile by over 5 percentage points per year.
Figure 2: Out-of-Sample Forward 12-Month Bond Returns by Downgrade Forecast
(Dec 1996 – Aug 2020)

Source: Verdad Bond Database.
The upgrade and downgrade forecasts can be combined into a unified ranking in pursuit of bonds that have both a high chance of being upgraded and a low chance of being downgraded. This combination results in a strategy of buying bonds that are cheaper than they should be, based on their fundamentals, while avoiding the riskiest CCC bonds because their high probability of upgrade is also associated with a high probability of downgrade. An additional benefit of this combination is that the downgrade model acts as a counterbalance to the yield preferences of the upgrade model. The downgrade model is fairly neutral to starting rating, as the average yield across all downgrade deciles is 7%. On the other hand, the upgrade model favors higher yielding bonds because of the linear relationship between credit rating and upgrade probability. As a result, bonds in the top decile of upgrade probability, which return 9.7% per year, also have a starting yield of around 10%. Therefore, integrating the two models should counteract any yield bias in the combined ranking.
The out-of-sample returns of this combined ranking are shown in the figure below. We also compare these decile returns against the average starting yield of each decile. The top decile of highest-ranked bonds has generated a 9.9% annualized return since 1996, outperforming the lowest decile by more than 6 percentage points per year. And importantly, the highest ranked bonds outperform their yield by more than 2 percentage points per year. This opportunity for outperformance also appears to be quite broad, with the top three deciles beating their yield by at least 90 bps per year.
Figure 3: Out-of-Sample Forward 12-Month Bond Returns by Combined Ranking
(Dec 1996 – Aug 2020)

Source: Verdad Bond Database.
We started this three-part research series with an article called “Beyond Yield”, where we argued that corporate bonds can earn a return above their yield due to changes in credit rating. We believe the figure above presents evidence that the anticipation of future rating changes—the prime objective of active bond picking—can be accomplished in a systematic manner using a quantitative model.
These out-of-sample results also bring good news for equity investors. If predicting rating changes is beneficial for bond returns, it should also be beneficial for the equity that’s subordinate to those bonds. Figure 4 confirms this point, based on the combined bond rankings from above. Stocks in the highest decile of combined bond ranking have returned 15.1% annualized since 1996, outperforming stocks in the lowest decile by more than 13 percentage points per year.
Figure 4: Out-of-Sample Forward 12-Month Equity Returns by Combined Rank
(Dec 1996 – Aug 2020)

Source: Verdad Bond Database.
We believe the out-of-sample performance of our credit models in the equity market serves as an additional robustness check. It makes sense that stocks in the lowest decile of combined bond rank barely return above 1% per year, underperforming most corporate bonds. After all, these equities are subordinate to low-quality credit that doesn’t even earn its starting yield because of downgrades.
On the other hand, equities in the top decile of combined bond rank earn a high return of 15% per year because they are subordinate to credit that is improving in quality and significantly outperforms its yield. The long-term evidence over more than two decades suggests that going beyond yield can be a winning formula for both credit and equity investors.