A Strange Divergence
Note: This will be our final Verdad Weekly Research note of 2019. We will return in January.
We have seen a massive divergence this year between the performance of US small-cap value stocks and US large growth stocks.
This year, stocks that were larger and more expensive performed better than stocks that were smaller and cheaper. This is a sharp divergence from the performance record of the last 30 years. Over the long term, betting on smaller, cheaper stocks has generated very attractive relative returns. This strange divergence in 2019 appears to have been true globally—in the US, Japan, and Europe. In Figure 1 below, we show the US market divided into quintiles by size and then by valuation.
Figure 1: Returns by Size and Valuation (Price-to-Book) in 2019 and over the Last 30 Years

Source: Ken French. These are the Ken French equal-weighted portfolios.
The cheapest and smallest quintile in 2019 returned less than 1%, while the largest and most expensive returned over 25%. This divergence is even more extreme when we look beyond the cheapest and smallest 20% of the market. If we look at the cheapest and smallest 10%, we see what’s driving the divergence.
Figure 2: Returns by Size and Valuation in 2019
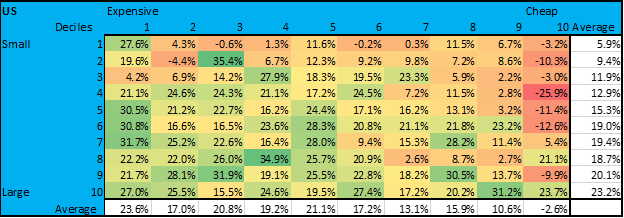
Source: Ken French. These are the Ken French equal-weighted portfolios
Deep-value portfolios of any size in 2019 were about 26% behind the most expensive decile of the market, with the smaller half of deep value performing even worse. We’re convinced that a proverbial monkey throwing darts in deep-value would have probably had a negative YTD return, while a monkey throwing darts at large growth stocks would have likely returned north of 20% YTD.
But most interestingly, a “market-cap-weighted” dart-throwing monkey would have done much better than an “equal-weighted” dart-throwing monkey. As we’ve seen, most index funds are cap-weighted by design, and most actively managed funds are cap-weighted by necessity. The Russell 2000 Index, for example, has 80% of capital invested in the fifth, sixth, and seventh size deciles and less than 20% in the smallest deciles of the market.
Based on our research, the only times worse than 2019 for US small-cap value on a relative basis were right before the Great Depression in 1929 and at the height of the tech bubble in 1999. In Figure 3 below, we show the ten worst 10-month periods for US small-cap value relative to large-cap growth over the past 100 years. On average, when small-cap value stocks have lagged by around 30%, the one- and three-year forward returns have been very attractive on an absolute and relative basis.
Figure 3: The 10 Worst Periods for Small-Cap Value Relative Performance

Source: Ken French. The returns are based on the equal-weighted quintiles of size and value. Latest data is October 2019 for the US.
While this may help demystify why different strategies have performed the way they have in 2019, what does this mean for investors going forward? How should we think about these extreme movements?
In Figure 4 below, we show the price-to-cash-flow multiples for the whole US market going back as far as we have data (to 1951). We include the two most extreme valuation deciles of the market (growth and value). We show the absolute trading multiples of each extreme as well as the ratio of the prices of the two (“spreads”) over time.
Figure 4: Price/Cash Flow Multiples and Spreads

Source: Ken French. Multiples shown above are the extreme value and growth decile breakpoints at the 10th and 90th percentiles of the market.
The “extremely extreme” divergence in the most extreme deciles of growth and value stocks we see in the trailing returns above appears to have caused a jump in spreads for deep value that is only rivaled by the tech bubble.
And these relative growth expectations matter, as we have shown. Pairing the historical price-to-cash-flow spreads above with the three-year forward relative returns to deep-value, we can see that when spreads rise, it’s usually a good time to get out of growth and into value.
Figure 5: Price/Cash Flow Spreads and Forward Returns

Source: Ken French. These are the equal-weighted deep value returns relative to extreme growth.
Moments like these are extremely rare in market history. However, looking at every 10-month period during the last ~100 years when small value has underperformed large growth by more than the YTD figures in 2019 (about 50 different times), you would have done quite well in the long haul to shift over to small value. You would have outperformed large growth 63.4% of the time over one year and 87.8% of the time over the next three years, earning a premium of 70% over three years relative to large growth. On an absolute basis, you would have made money in small value 65.9% of the time over the next year and 85.4% of the time over three years.
From a trailing returns and relative valuations perspective, the extreme movements of deep-value small caps we’ve seen in the last year look an awful lot like the tech bubble. The base rates above suggest investors would be wise to reduce their exposure to large-cap growth stocks over the next decade and (if possible) increase exposure to equal-weighted small value. Investors in cap-weighted products or indexes, such as Vanguard's or the Russell 2000 small-cap index, should be aware that the large size-factor tilt (that has done so well recently) is probably baked into future results more than the title of the product might imply.